

Price, Volume, Mix: how to explain why revenue actually moved
“Revenue was favorable by 162.” I’ve said that line in a review, and I know exactly what happens next. Somebody asks why. Not the number, the reason behind the number. Did we sell more? Did we charge more? Did customers shift toward the premium products? The variance is a fact. The room wants an answer.
Price, Volume, Mix analysis is how I turn that fact into an answer. PVM splits one revenue variance into three separate effects that add back exactly to the total, and each effect points at a different owner and a different action. Once you can say “we beat budget because the mix shifted toward richer products, even though we sold fewer units,” you’ve stopped reporting and started advising.
This is the guide I wish someone had handed me early in my career: the intuition, the math, and a worked example you can rebuild in a spreadsheet. The exact model is the download at the end.
The one idea behind PVM
Revenue is never one number. It’s a bundle of decisions: how many units moved, what you charged for each one, and which products made up the sale. So when revenue changes between two periods, budget versus actual or this year versus last, the change has to come from some combination of those three levers. PVM just separates them so you can see how much each one contributed.
A revenue variance is the sum of three effects: the change from selling more or fewer units (Volume), the change from charging more or less per unit (Price), and the change from selling a different blend of products (Mix). Get the decomposition right and the three add back exactly to the total variance.
The three effects
Did you sell more or fewer units?
Isolates the pure quantity change, holding price and product mix constant. This is the “we moved more boxes” effect.
Did the blend of products shift?
Captures customers moving toward higher- or lower-priced products, holding total volume constant. The subtle one, and often the story.
Did you capture more or less per unit?
Measures pure price realization on the units you actually sold. Discounting, list-price changes, and promotions all land here.
Why bother separating them? Because they have different owners and different fixes. A volume shortfall is a demand conversation with sales. A mix shift is a product and go-to-market conversation. Price erosion is a discounting discipline conversation, and I’ve never seen one fix itself. Lump them together and you have a number. Split them apart and you have three specific things someone can act on.
The math, without the mystery
There are a few conventions for PVM and teams argue about the edges. Here’s the version I use, because it keeps the three effects additive. For each product you need four inputs: budget volume, budget price, actual volume, and actual price.
Volume effect = (Actual volume − Budget volume) × Budget price
Price effect = (Actual price − Budget price) × Actual volume
# Mix falls out when you have more than one product:
# it is the part of the volume change explained by the
# blend shifting, valued at each product’s price gap to
# the overall average. In the model, Mix is computed as
# the residual that makes the three effects tie to total.
The discipline that matters is the tie-out. Add Volume + Mix + Price across all products and the result must equal the total revenue variance. Not roughly. Exactly. If it doesn’t, one of your baselines is inconsistent, usually a price computed on the wrong volume. I’m strict about this because a model that ties out is a model I can defend in front of a CFO, and a model that doesn’t is a guess with formatting.
A worked example
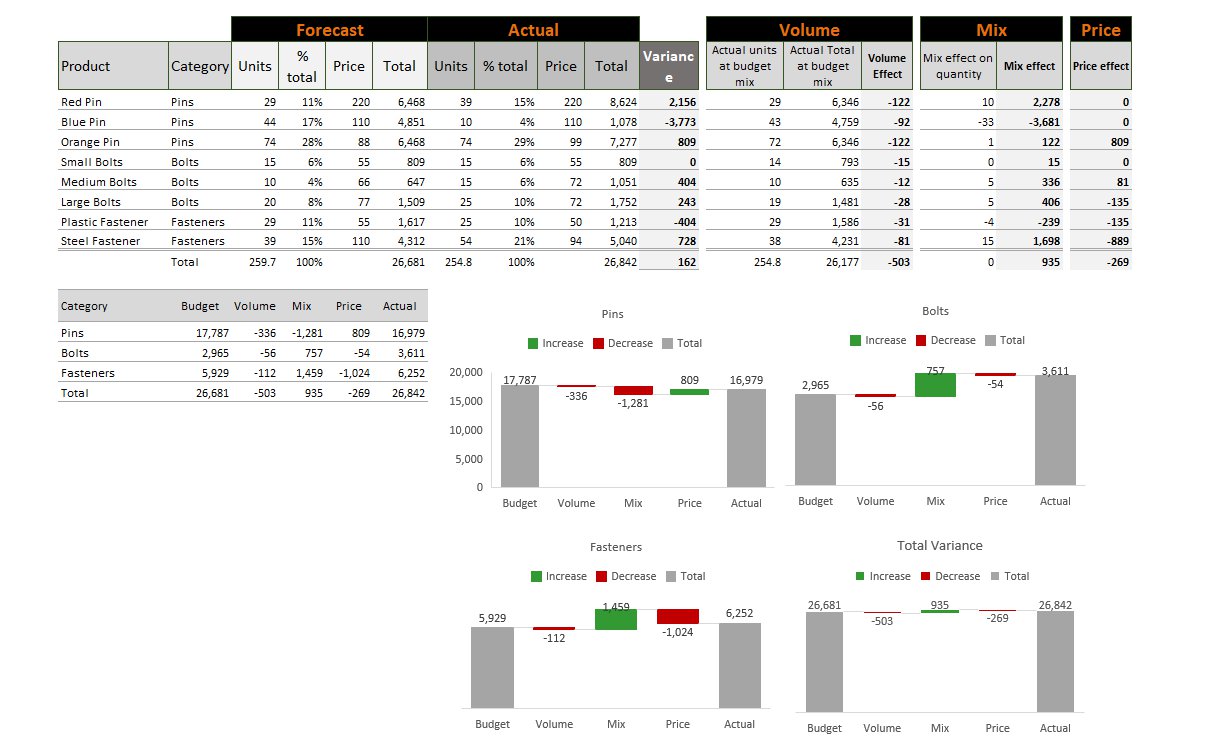
Here’s the case from the model: a business selling three product families, Pins, Bolts, and Fasteners. Budget said one thing. Actuals came in differently.
| Category | Budget | Actual | Variance |
|---|---|---|---|
| Pins | 17,787 | 16,979 | −808 |
| Bolts | 2,965 | 3,611 | +646 |
| Fasteners | 5,929 | 6,252 | +323 |
| Total | 26,681 | 26,842 | +162 |
At the summary level this looks quiet. Revenue up 162 on a base of 26,681, well under one percent. The kind of variance a board deck waves through as “broadly on plan,” and I’ve heard that exact sentence said about numbers like this. But quiet totals hide loud movements. Decompose the same 162 and a very different picture shows up.
| Effect | Amount | What it means |
|---|---|---|
| Volume | −503 | Sold fewer units overall |
| Mix | +935 | Shifted toward richer products |
| Price | −269 | Realized slightly less per unit |
| Total variance | +162 | Ties to the top line |
Now the story writes itself. The business did not beat budget by selling more. Volume was down 503. It beat budget because the mix shifted hard toward higher-value products, plus 935, which more than paid for the volume shortfall and a small price leak of 269. The calm headline was hiding a volume problem, a mix win, and a pricing leak, all at the same time.
Three completely different conversations were buried inside one calm number. Without PVM, none of them get raised. With it, you walk into the review holding a volume question for sales, a mix insight for product, and a pricing flag for commercial. The +162 becomes the least interesting thing you say.
How to read each effect in practice
When Volume moves
A negative volume effect is a demand or capacity signal, but before you escalate it, check whether it’s broad or concentrated. Is every product down a little, or is one line collapsing while the others hold? “The whole market softened” and “we lost a key account” need completely different fixes, and product-level PVM tells you which one you’re looking at.
When Mix moves
Mix is the effect people miss, and it can flatter to deceive. A positive mix effect because customers chose your premium products is a genuine win worth doubling down on. A positive mix effect because your cheap products ran out of stock is not a strategy, it’s a supply accident that will reverse next quarter. Always ask why the mix shifted before you celebrate it.
When Price moves
Price is the cleanest to act on and the easiest to lose quietly. A small negative price effect spread across every product usually means discounting crept into the sales motion. Each deal shaves a little, and no single decision looks wrong. The leak only shows in the aggregate, and the aggregate is exactly what PVM puts on the page.
Where PVM fits in your reporting
I don’t treat PVM as a special project you run once a year. It belongs in the standard monthly close, sitting right under the revenue variance in the board pack. The moment a revenue number moves and someone asks why, the decomposition should already be on the page. That’s the difference between a finance team that reports the weather and one that explains the climate.
And it scales. The same three-effect logic works across products, regions, channels, and customer segments, anywhere revenue is quantity times rate across a portfolio. Build it once, cleanly, with a proper tie-out, and you can point it at almost any part of the business.
Build it yourself
The fastest way to make PVM stick is to build the model and watch the three effects tie back to the total. The download below is the exact spreadsheet behind this article: the Pins, Bolts, and Fasteners example fully worked, with the volume, mix, and price waterfalls and every formula visible, so you can trace the logic and then point it at your own data.
Get the PVM model behind this article
The exact Pins, Bolts, and Fasteners spreadsheet, fully worked: volume, mix and price effects, the tie-out, and the waterfall charts. Enter your email and it lands in your inbox.