

The Cash Conversion Cycle, Rebuilt for the AI Era
Every finance team can recite the three levers of working capital. Almost none of them can tell you, this afternoon, what happens to cash if you shorten payment terms on your top ten customers by nine days.
That gap – between knowing the theory and being able to move it on demand – is the whole story of this piece. The cash conversion cycle is one of the oldest, most durable ideas in finance. It is also one of the most under-worked. Most companies measure it once a quarter, put it on a slide, nod at it, and move on. It sits there as a number, not as a set of decisions.
So let me do two things. First, walk the theory all the way down, because the calculation only earns its keep when you understand what each piece is really telling you. Then show you what I actually built: a workflow that analyzes each of the three components, iterates with a human on the levers that move them, and ends in a simulation tool you can put in front of management and let them turn the dials themselves. Theory first. Then the build.
What the cash conversion cycle actually measures
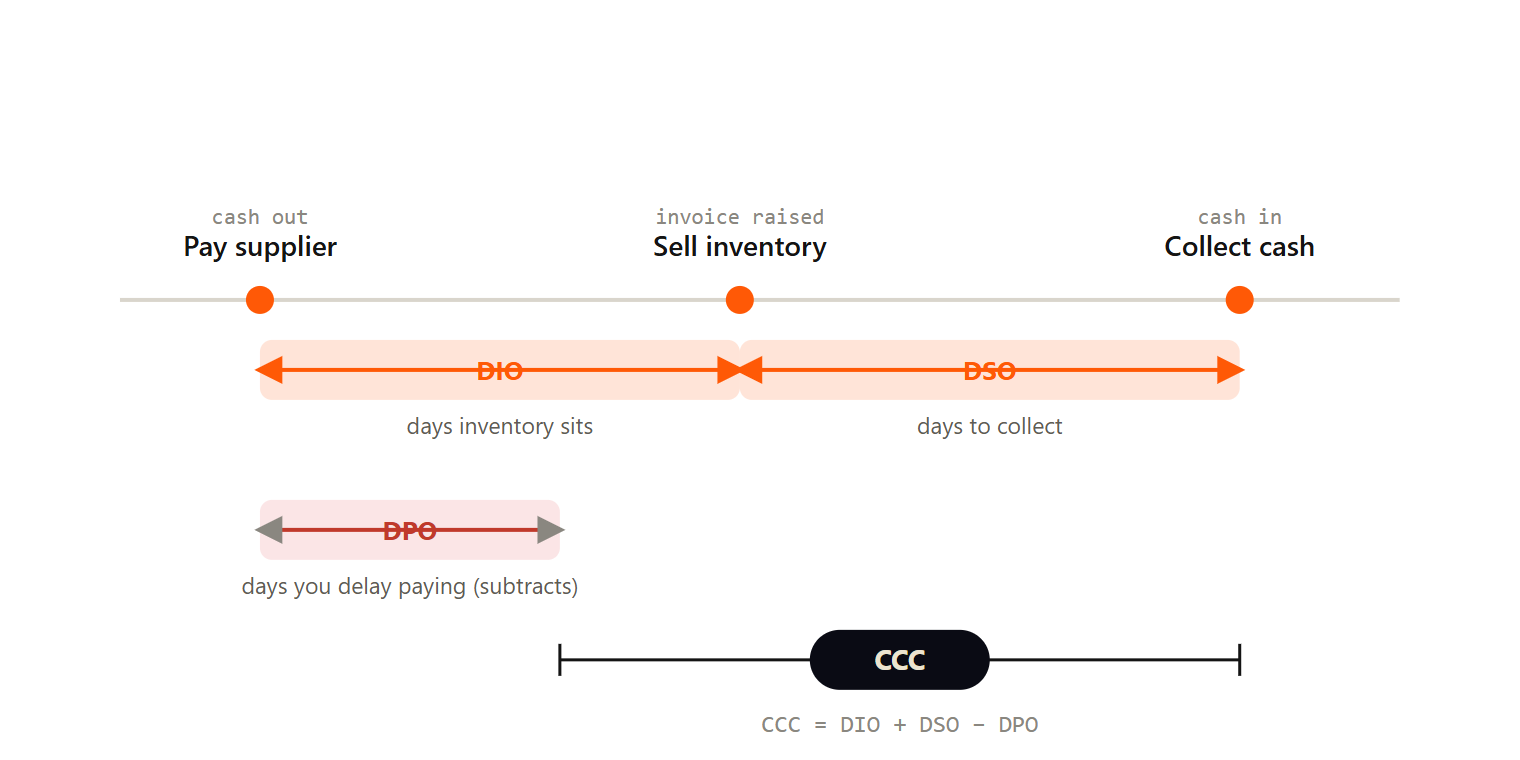
Strip away the acronyms and the cash conversion cycle answers one blunt question: once you spend a dollar to make or buy the thing you sell, how many days pass before that dollar comes back to you as cash?
That is it. It is the number of days your money is locked inside the business – tied up in inventory sitting on a shelf, or in an invoice a customer has not paid yet – minus the days you get to hold onto your suppliers’ money before you pay them.
A short cycle means cash comes back fast and you can fund growth out of your own operations. A long cycle means you are financing your own working capital, often with a credit line, often without anyone naming it as a decision. The cycle is measured in days, and every day has a price.
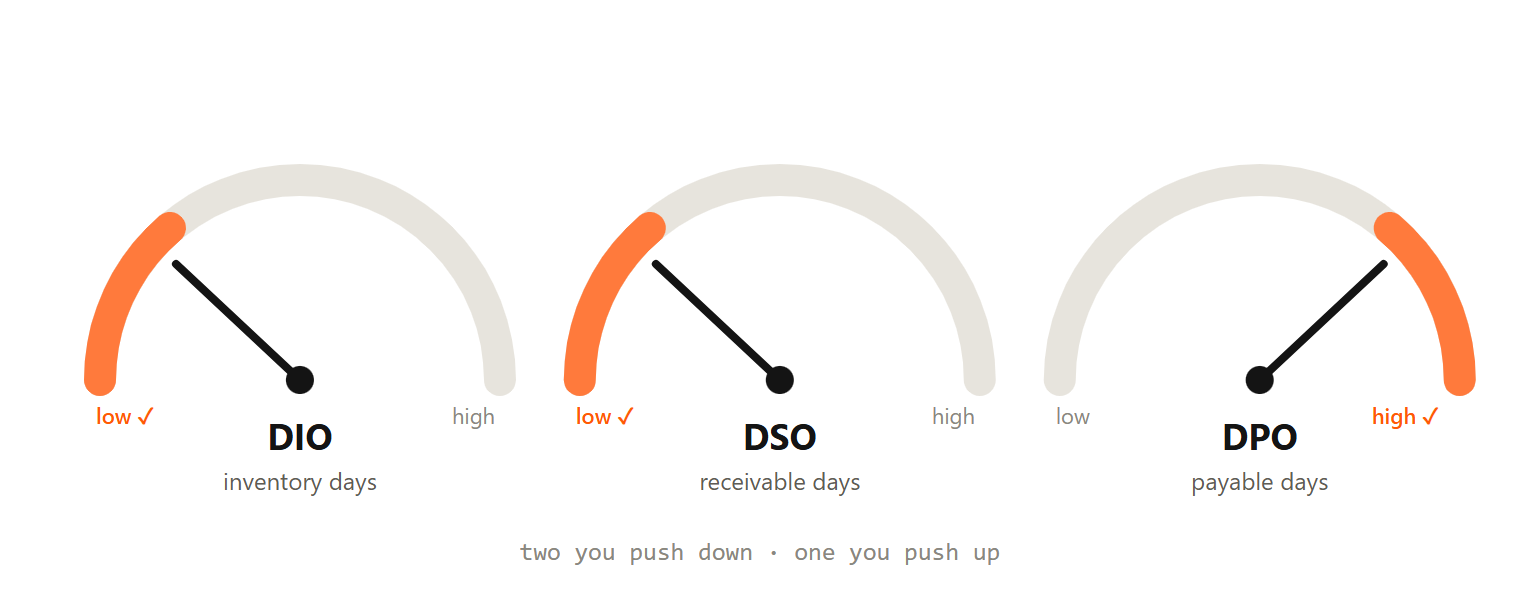
Three components. Days of Inventory Outstanding, Days of Sales Outstanding, Days of Payables Outstanding. Two of them you want low. One of them you want high. Understand each one on its own and the whole cycle stops being a slide and starts being a set of levers.
The three components, one at a time
Days Inventory Outstanding (DIO) – how long product sits before it sells
DIO measures the average number of days inventory stays in the business before it is sold. You bought it or built it, it is sitting somewhere, and until it sells it is cash on a shelf.
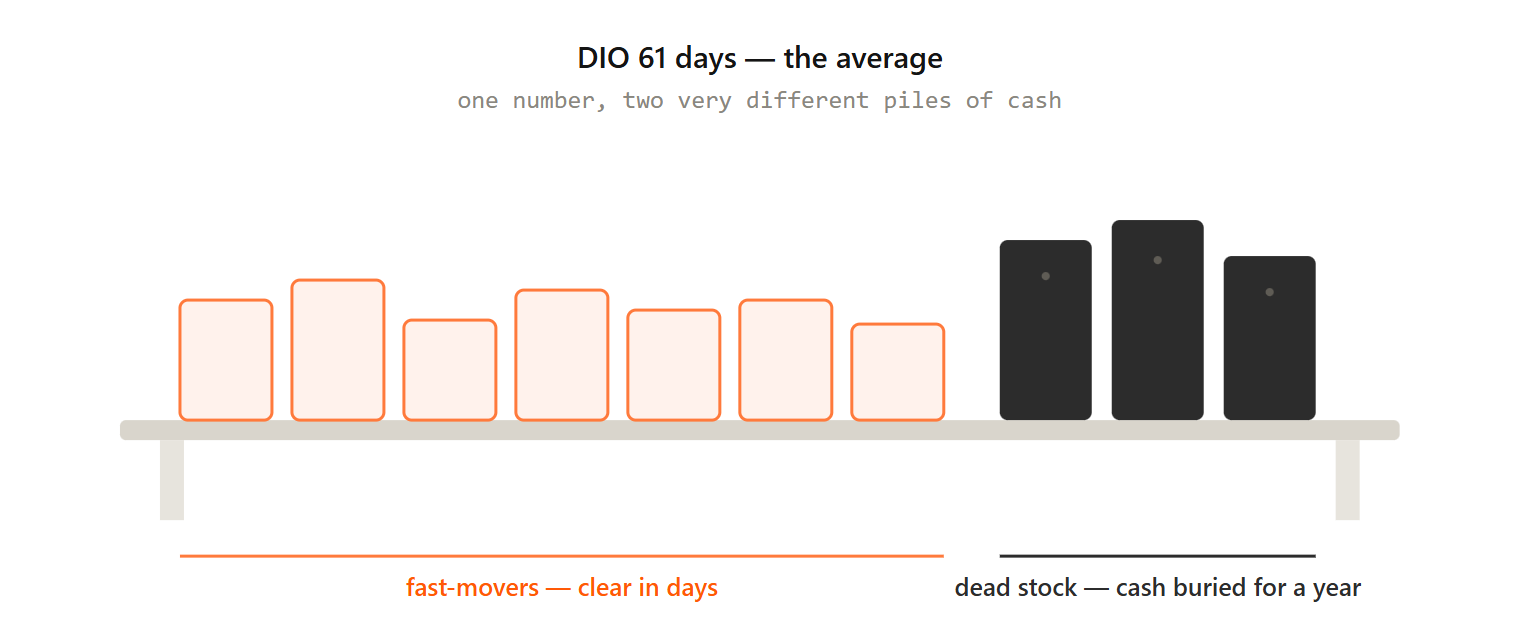
If your average inventory is 2 million dollars and your annual COGS is 12 million, your DIO is about 61 days. Two months of cash, frozen as stock, on average, all the time.
The thing finance people miss about DIO is that it is not one number – it is an average hiding a distribution. The 61 days is a blend of fast-movers that clear in a week and dead stock that has not moved in a year. The average looks fine while a chunk of your cash is buried in SKUs nobody is buying. Hold that thought, because it is exactly the kind of pattern a probabilistic model surfaces that a quarterly average never will.
Days Sales Outstanding (DSO) – how long customers take to pay
DSO measures the average number of days it takes to collect cash after a sale. You delivered, you invoiced, and now you wait. Every day of DSO is a day you have handed a customer an interest-free loan.
If average receivables are 3 million and annual revenue is 20 million, DSO is about 55 days. On paper your terms might say net 30. The 55 tells you what is actually happening: a gap between the terms you wrote and the behavior you tolerate.
DSO is the component finance teams feel most viscerally, because it is the one the collections calls are about. It is also the one most tangled up in relationships – the big customer who always pays late and always gets away with it, the terms nobody wants to renegotiate because sales owns the account.
Days Payable Outstanding (DPO) – how long you take to pay suppliers
DPO is the mirror image, and the one you want high. It measures how many days you take to pay your own suppliers. The longer you hold onto that cash, the longer it funds your operations instead of theirs.
If average payables are 1.5 million against 12 million COGS, DPO is about 46 days. You are effectively borrowing 46 days of financing from your supply base, for free, as long as you do not damage the relationship or forfeit an early-payment discount worth more than the days are worth.
That last clause is the trap in DPO. Stretching payables looks like free money right up until you skip a 2 percent discount for paying in 10 days, which – annualized – is one of the most expensive forms of financing there is. DPO is not “pay as late as possible.” It is “pay at the moment the math turns against waiting.” Nobody computes that moment by hand across a whole supplier base. A model can.
Inventory sitting as cash
Days product waits on the shelf before it sells. An average that hides where the cash is really buried.
▼ want it lowerCustomers holding your cash
Days between invoicing and getting paid. The gap between the terms you wrote and the behavior you tolerate.
▼ want it lowerTheir cash funding you
Days you take to pay suppliers. Free financing – right up until you forfeit a discount worth more than the days.
▲ want it higherPutting it together: the worked example
Take the three numbers above and run the cycle:
| Component | Value | Direction you want |
|---|---|---|
| DIO | 61 days | Lower |
| DSO | 55 days | Lower |
| DPO | 46 days | Higher |
| CCC | 70 days | Lower |
Seventy days. For roughly ten weeks, on average, every dollar this business spends is out of its hands before it returns. If the company does 20 million in revenue, that cycle is tying up real money – money that is either sitting idle as working capital or being financed on a line of credit at whatever rate the bank is charging this year.
A single day off the cash conversion cycle frees up cash roughly equal to one day of the relevant flow. Shave 15 days off this cycle and you have pulled a meaningful, permanent chunk of cash out of operations without raising a dollar of new financing. That is the prize. The rest of this piece is about how to actually go get it, instead of admiring the number once a quarter.
How to improve each lever (the honest version)
Every list of “ways to improve your CCC” reads the same and stops at the obvious. Here is the fuller version, component by component, including the second-order costs nobody puts on the slide.
To lower DIO (inventory)
- Tighten demand forecasting so you order to actual signal, not to a safety-stock habit.
- Kill dead stock deliberately – clear SKUs that have not moved, even at a discount, because the cash is worth more than the margin you are protecting.
- Shorten supplier lead times so you can hold less buffer for the same service level.
- Move toward just-in-time where the supply chain can support it – and be honest about where it cannot, because a stockout has its own cost.
To lower DSO (receivables)
- Invoice the day you deliver, not at month-end batch. Days of DSO are lost in the gap between “done” and “invoiced.”
- Offer early-payment discounts where the discount costs less than the financing the days are costing you.
- Tighten credit terms on new customers and enforce the terms you already have.
- Automate the dunning – the polite, escalating reminders – so collection is a system, not a person remembering.
- Have the uncomfortable conversation with the chronic-late big account. Usually the terms were never really enforced, only written.
To raise DPO (payables)
- Renegotiate terms with suppliers from a position of being a reliable payer, not a late one.
- Take the full term you have already agreed to – many teams pay early out of habit, forfeiting free financing.
- But never at the cost of a worthwhile early-payment discount. Compute the annualized cost of skipping it before you stretch.
- Consolidate spend with fewer suppliers to earn better terms.
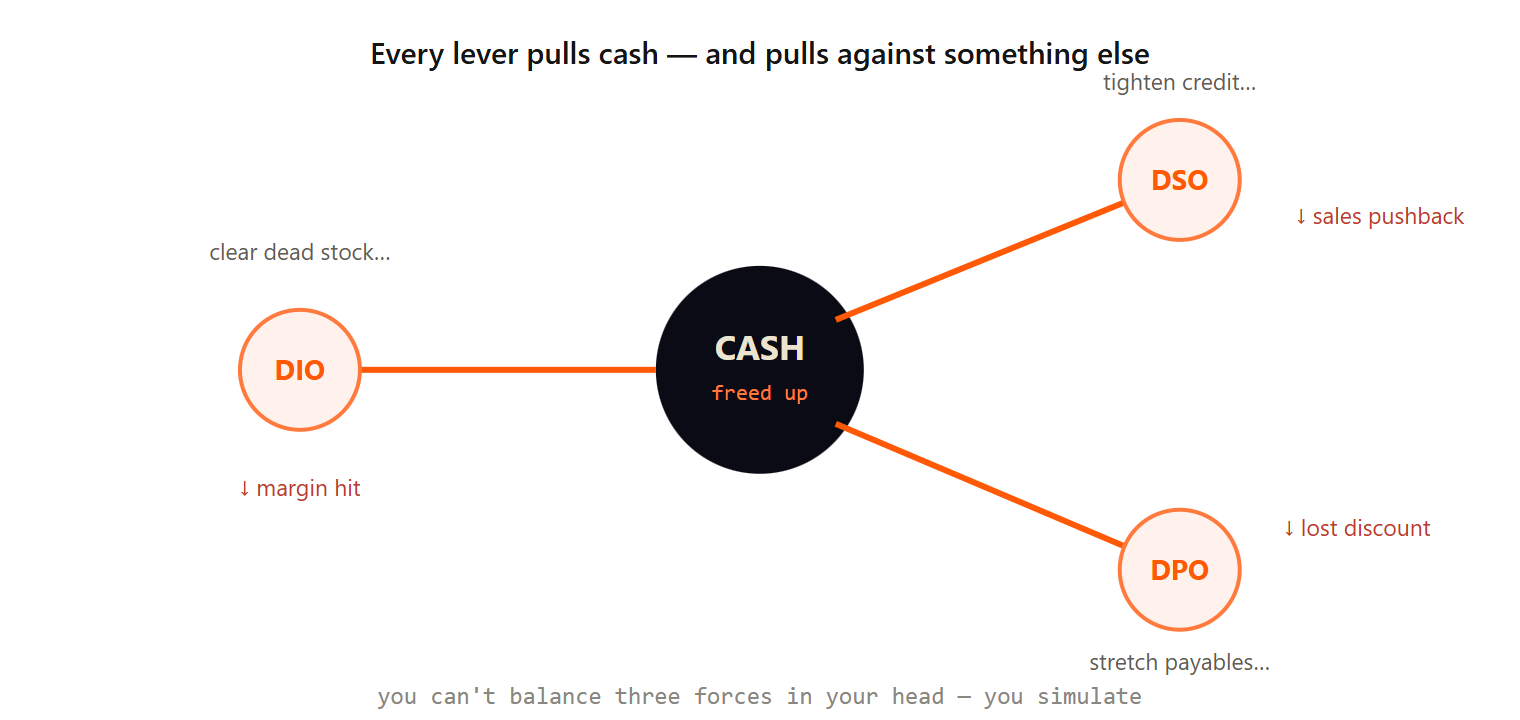
Read that list again and notice something: every lever trades against another metric. Clear dead stock and you take a margin hit. Tighten credit and sales pushes back. Stretch payables and you risk a discount or a relationship. There is no free move. Which is precisely why this belongs in a simulation, not a memo – because the right answer is a balance across three tugging forces, and you cannot balance three forces in your head.
The old way this got analyzed – and why it broke
For most of finance history, the cash conversion cycle got handled like this: someone pulls the balance sheet figures once a quarter, computes the three ratios, drops them in a deck, and writes a line of commentary. “CCC up 4 days versus prior quarter, driven by inventory build.” Everyone nods. Nothing moves.
The reason nothing moved was not laziness. It was that the analysis stopped exactly where the hard part started. Computing the three ratios is arithmetic. The actual work – which SKUs are the dead stock, which customers are dragging DSO, which suppliers have room in their terms, and what happens to cash if you pull three levers at once – was slow, manual, and spread across systems that did not talk to each other. So it did not get done. The CCC stayed a number you reported, not a number you managed.
That is the part that just changed. Not the formula. The cost of doing the work behind the formula.
What I actually built: the workflow
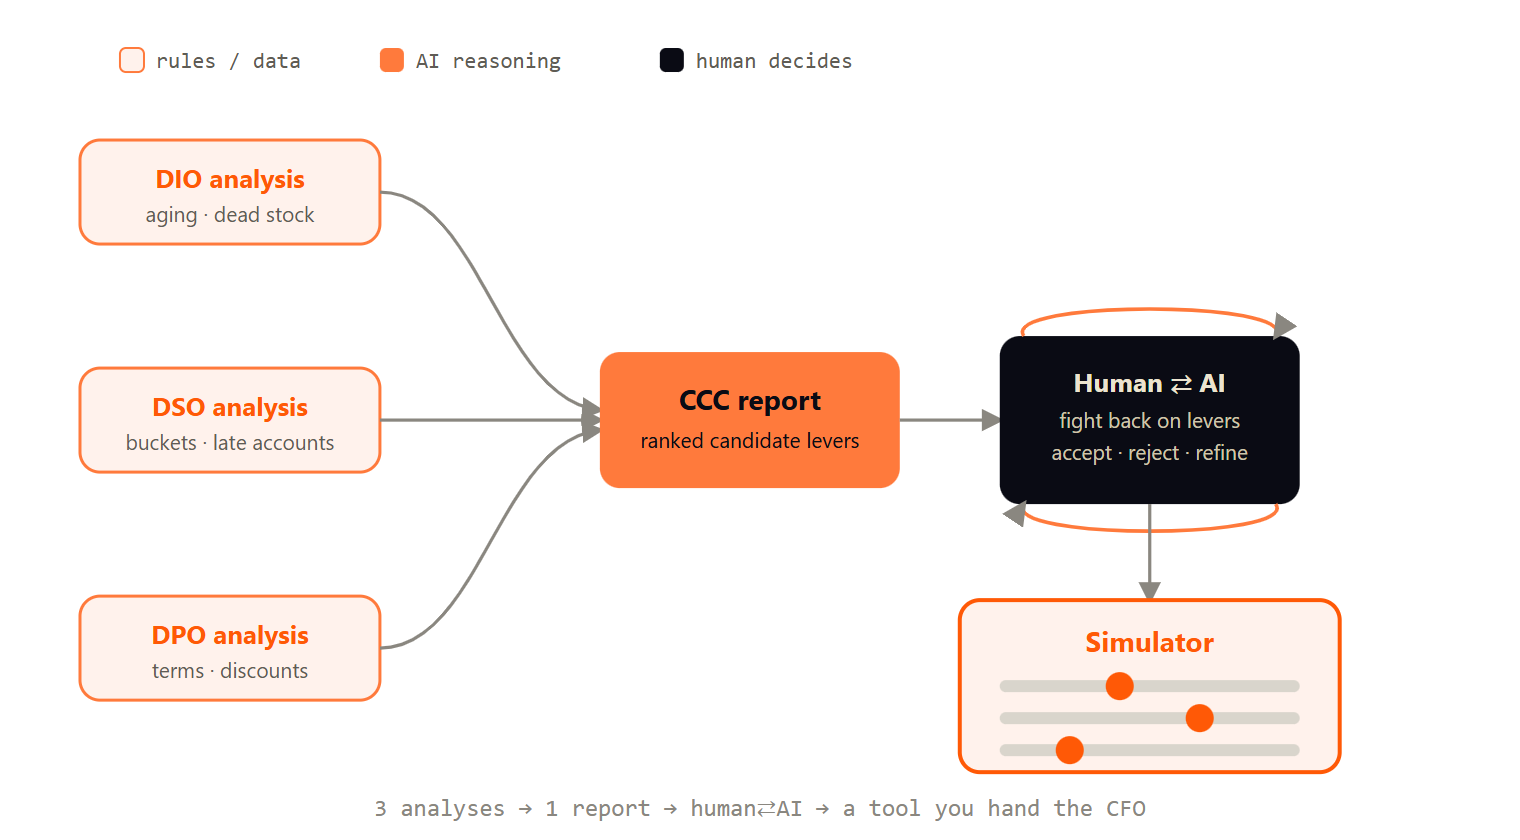
So here is the build. I want to be precise about it, because the interesting part is not “AI looked at my cash.” The interesting part is the structure – where the rules run, where the AI reasons, and where I, the human, stepped in and pushed back. The workflow has four moves.
-
Three separate analyses, one per component
Not one big “analyze my working capital” answer – that is how you get mush. Instead the workflow runs three focused analyses: inventory (the DIO story – aging, dead stock, the distribution behind the average), receivables (the DSO story – aging buckets, the chronic-late accounts, terms-versus-behavior gaps), and payables (the DPO story – where terms are under-used, where discounts are on the table). Three analyses, each narrow enough to be sharp.
-
One full analysis and report for the whole cycle
The workflow then synthesizes those three into a single cash conversion cycle report: here is your CCC, here is what each component contributed, here is where the cash is actually trapped, and here are the candidate levers ranked by how much cash they would free versus what they would cost you elsewhere.
-
The human in the loop – this is the part that matters
I did not take the report as gospel. I sat with it and I fought back. The AI proposed levers; I challenged them against reality it could not see – the customer relationship not worth straining, the supplier where “free financing” would cost us the priority slot in a shortage, the dead stock that is actually strategic buffer for a key account. That back-and-forth, that grid between what the AI surfaced and what I know about the business, is where the real lever list got made. Not from the AI. From the iteration between me and the AI.
-
Turn the agreed levers into a simulator
Once the human-and-AI grid produced a lever list we both trusted, I put that back into the workflow and asked the AI to build an interactive tool – a simulator where each lever is a dial. Move DSO down nine days, move DIO down five, hold DPO steady, and the tool shows the new cash conversion cycle and the resulting cash projection, live. Not a static scenario in a deck. A tool management can hold and turn themselves.
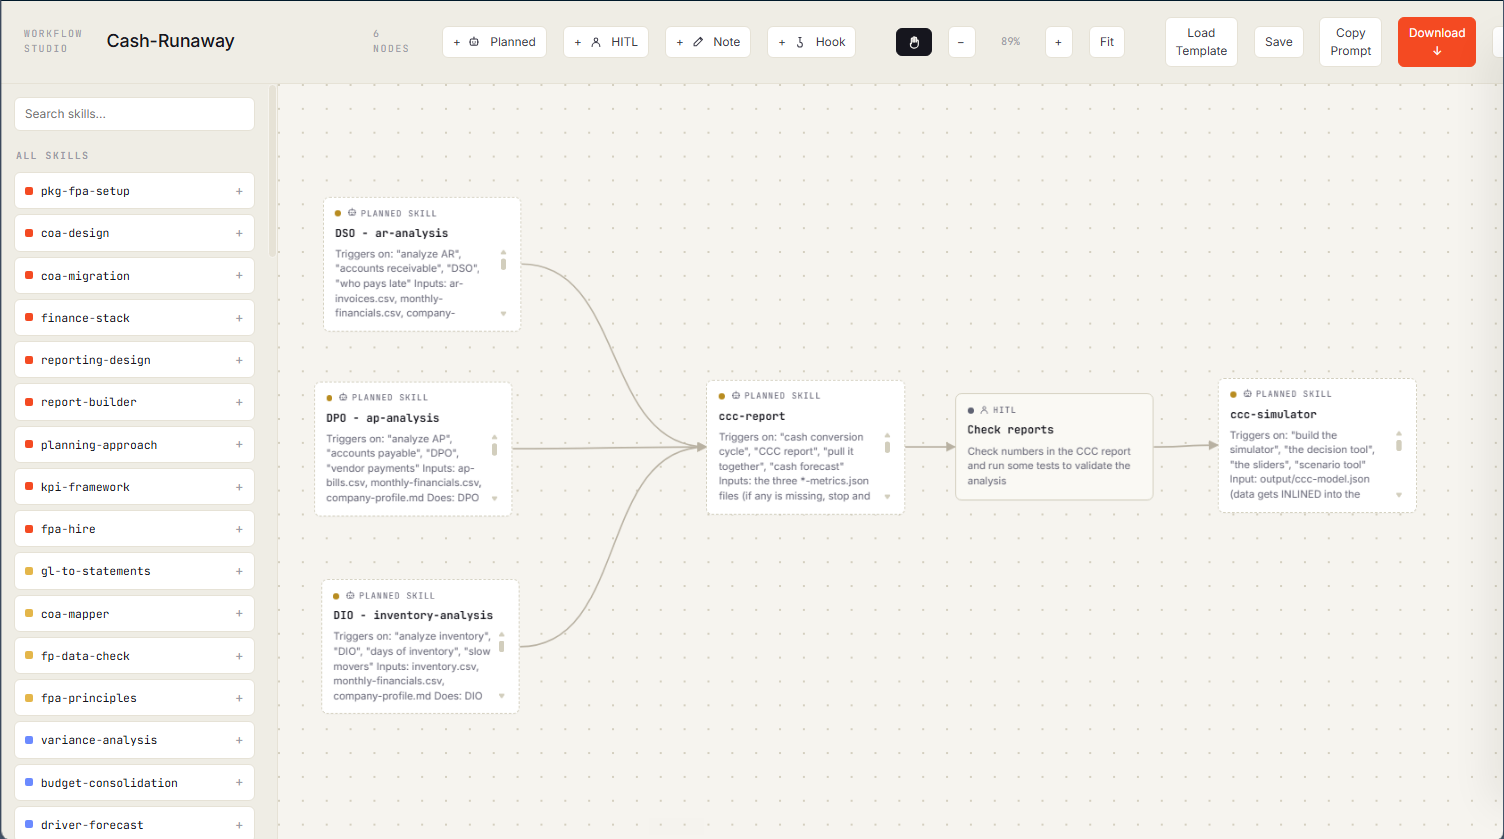
This is how I built the Cash-Runaway workflow in my Tactic OS app. This app is not for sale. It’s exclusive to my students at the AI FP&A Accelerator.
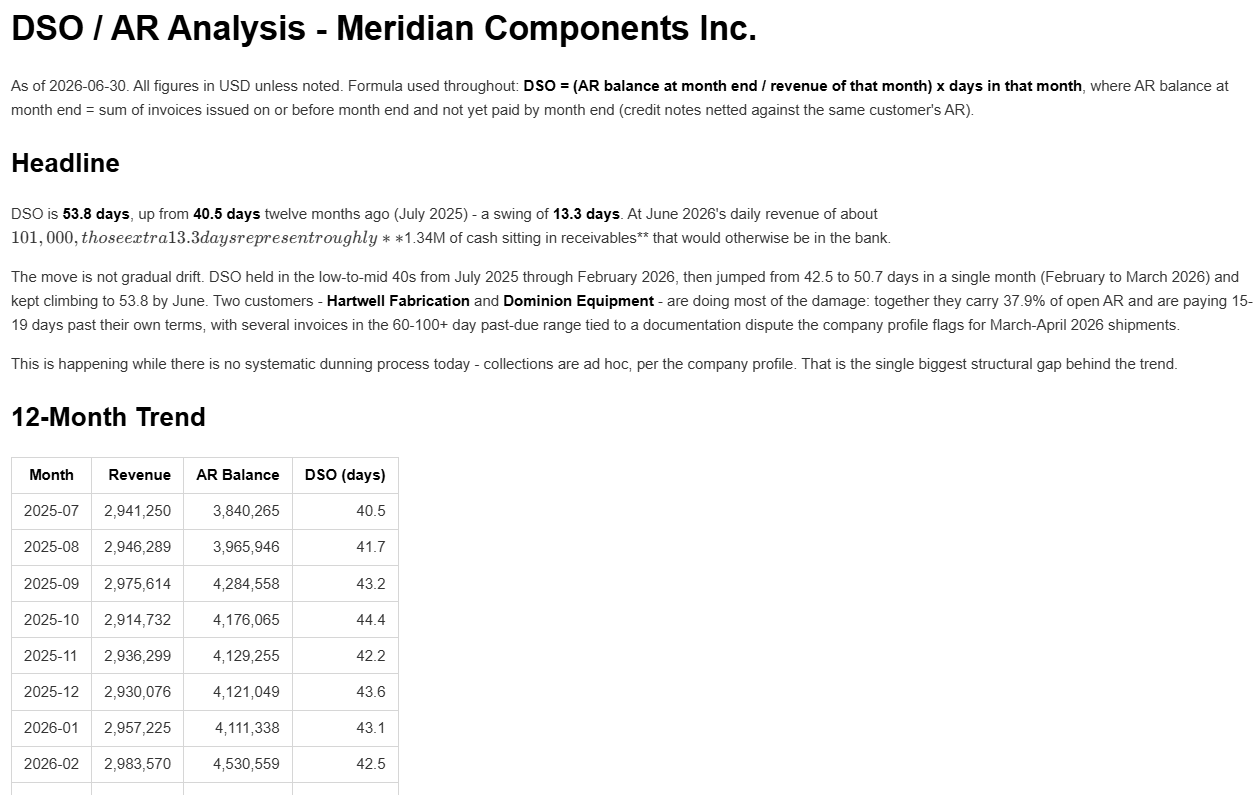
And this is the move that makes the whole thing trustworthy. Look closely at the next screen, because it is the human-in-the-loop checkpoint in the act of working.
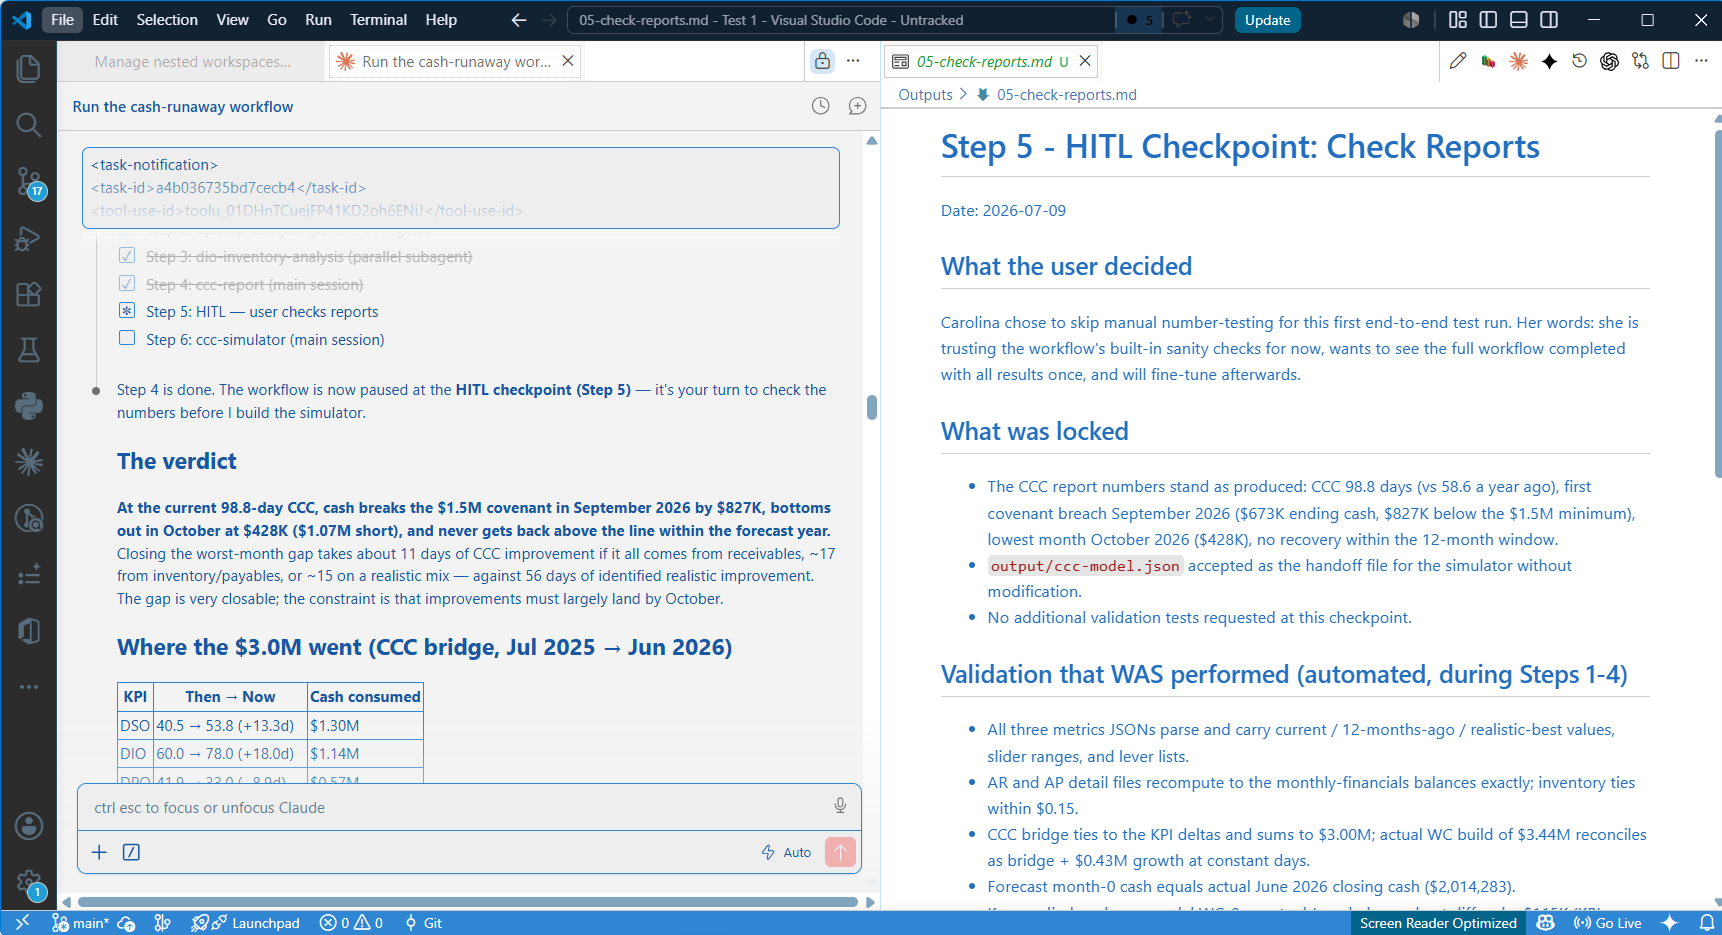
Claude is programmed to halt at this checkpoint. Steps 1-4 are done and greyed out; Step 5 is active and the run is paused – it will not build the simulator until a human has checked the numbers. The AI does not just march on.
The human’s decision is recorded into a report – what was decided, what was locked, what validation ran. That file becomes the audit trail: months later, anyone can see who signed off on which numbers, and why.
Try it on the same data I used
The fastest way to make any of this stick is to run the analysis yourself. The dataset below is the exact synthetic company behind this workflow – a mid-size manufacturer whose cash quietly fell from 5 million to 2 million in a year while staying profitable every month, with a machine failure forcing 2 million of unplanned payments right as the covenant line looms. It is realistic, messy in the right ways, and small enough to work through in an afternoon.
Download the cash analysis dataset
Seven files: 12 months of financials, invoice-level receivables, bill-level payables (with terms and early-pay discounts), a SKU-level inventory snapshot, a forward plan, and the planned disbursements. Point your own AI workflow at it and build the three analyses, the CCC report, and your own set of levers. Enter your details below and it lands in your inbox.
See the simulator – move the dials yourself
And here is where the workflow ends: the tool the levers became. This is the actual simulator, embedded live – not a picture of it. Drag the sliders for DSO, DIO and DPO and watch the cash conversion cycle and the cash projection recompute. The rules do the math; you make the call.
Cash scenario simulator
Open full screen ↗Sliders live. All numbers synthetic (Meridian Components, the dataset above). Use “Open full screen” for the full-width view.
Why the split is the whole point
Look at where each kind of work landed, because this is the transferable lesson.
The rules own the math. DIO, DSO, DPO, the CCC – those are formulas. You do not want a probabilistic model doing arithmetic it might get subtly wrong. The calculation layer is deterministic and it stays that way.
The AI does the reasoning the old workflow skipped: reading the distribution behind the average, spotting the SKU cluster and the customer pattern, drafting the lever candidates and the language of the report. This is where a probabilistic model earns its place – not by computing the cycle, but by surfacing the levers a human staring at a quarterly average would never think to pull.
And the human signs. I decided which levers were real, which trade-offs the business would actually accept, and what we would put in front of management. The AI never made that call. It made the call possible by doing, in an afternoon, the analysis that used to be too expensive to do at all.
Rules own the math. AI drafts the language and finds the patterns. A human signs the decision. That split is why the output is trustworthy enough to hand upward – and it is why the end product is not a report at all. It is a simulator that lets management own the judgment themselves, one dial at a time.
The cash conversion cycle was never really a reporting problem. It was a decision problem wearing a reporting problem’s clothes. The formula told you the number. It never told you what to do about it. Now the work behind the number is cheap enough to do properly, and the job moves – the way it always does – to the person who decides which lever to pull, and puts their name on the projection.
Go find the day. There are fifteen of them hiding in your cycle.
Get the cash analysis dataset behind this article
The exact synthetic manufacturer used in the workflow: 12 months of financials, invoice-level AR, bill-level AP with terms and discounts, a SKU inventory snapshot, and the forward plan. Build your own DSO, DIO and DPO analyses on it. Enter your details and I’ll send the dataset straight to your inbox.